Posts

Showing posts from May 23, 2021

HDFC AMC- Observation

Image
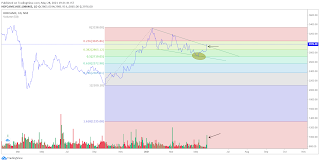
 Swing Trade. Lets Look at the HDFC AMC chart and try to analyze its behavior. We will apply here 2 ways analysis means on one side we will look for price action and on second side we will look for indicators. Price Action: If we see the line chart there is "Flag and Pennant" pattern one of the most powerful pattern in technical analysis. We can see that price exactly respect the 50 Fibonacci ratio which is a very good ratio (where pullbacks are retested) and move. If you see it gave good a breakout of pennant pattern with good volume.  Now let us switch to candlesticks to get more 3D kind of view. What indicator tells? If you see the chart here you will find that there was squeeze and it broke out that means its volatility is increasing. Also if you see that there is RSI above 60 which indicates the momentum or speed. Also there is MACD crossover which also generates a buy signal. So from both of the side stock is looking nice for swing trading. Target Now the question is ho

IOC Chart Observation

Image
 CUP Pattern (4 Months) Conditions: 1. Pattern must be at least 6 to 8 weeks. 2. There should be great volume on right side of the pattern. 3. May re-test or not the neckline. In this case it has tested. 4. Target should be around the depth of the CUP. 5. Stop loss should be bellow the Re-tested Zone. Additional Check. 1. RSI above 60. There is momentum in the price. 2. BB% greater than 70 there is volatility in the chart. Target - 121 Stop Loss - 103 Risk to Reward 1.5 Note: This is for knowledge purpose only.

Buyable Gap Up

Image
How to Trade or Invest using GAPS? Most scary thing in the world of 'stock market' is 'gaps-up'. it becomes very difficult to manage trade when security opens 'Gap-up'. So what is the right way to trade gaps or take position on the basis of gaps. There are three rules that must be check before trading gap-up market. 1. ATR :  Check 40 period ATR before gap-up. The price move must be at least 75% of that value. 2. Volume : Volume must be 150% of 50 DMA volume. This Gap-up must be occur in constructive consolidation or an uptrend. Let's look at the chart and understand. Let's look at the chart.  There is a Gap-up 40 period ATR before Gap-up was 111.89. Price should Gap-up at least 75% of ATR that means 83.91. We can see price Gapped-up 245 (i.e. 32,450 - 32,205) Volume is 150% or 3 times. 50 SMA Volume is 162.40K and Gapped-up volume is 527.42K All three conditions are meeting the criteria. Now where to entry and what should be your stop loss is clearly me