Posts

Showing posts with the label MBA Finance

Accumulation VS Distribution Phase
Image
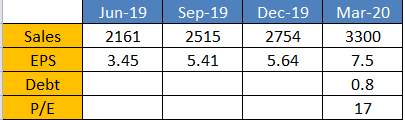
  How to know if the stock of a company is in 'Accumulation Phase' or Distribution Phase'?   This is a very common question every investor asks before an investment in value stocks. Sometimes what we see is stock, take the move and go sideways so it becomes difficult for an investor  to identify whether this sideways phase is for accumulation or distribution and how we should understand this ? Here is the simple trick with the help of which you can easily identify the stock phase. There are three major players (Smart Money) which play an important role in shareholding of any company. a) Promoter. b) Mutual fund or Insurance companies. c) FIIs (Foreign Institutional Investors) So let us understand how we will identify smartly which company is good for investment. Step 1: Find a good fundamental company.( Smartly) a. Sales must be increasing. b. EPS should be increasing. c. Low debt. d. P/E should be less than industry. eg. KEC intnl. Step 2: L...

Systematic Risk vs Unsystematic Risk. How to calculate Beta ?

Image
When a company starts a business has to face two kinds of risk one is systematic and another is unsystematic risk.  1. Systematic risk -   It is non diversifiable risk. It exists  because of macroeconomic factors like- Political, Legal, Economical, Social, Legal Rules and Laws. Because it exists into the system so it is a non diversifiable risk.   2. Unsystematic risk -   It is diversifiable risk. It exists  because of microeconomic factors like- Weak internal control, Weak management, Bad Strategies, Bad product line.    Example of unsystematic risk - Business Risk or Financial Risk. When we talk about beta it is a systematic risk which is non diversifiable. Which measures the volatility of the stock with respect to the market. High beta stocks: These stocks outperforms the market when market rises provided financials should allow and falls heavily when the market does fall. Low beta Stocks: These stocks neither outp...

How to analyse the management of the company ?

Image
Company Analysis! Qualitative Analysis Why do retail investors always fail to pick the quality stock?  Why does it become so necessary to look at the management as a whole before any kind of an investment? "New Car - Bad Driver - Definitely there will be an accident. Old Car - Good Driver - Definitely you will reach the destination." Fundamental Analysis of any company starts with 'quality analysis' followed by 'quantity analysis' Quality analysis of any company is more subjective however quantity analysis is more objective and numeric. Everyone says see the management but nobody talks about how to see the management. We will  analyse the management as a whole not in a very concentrated way. Which means we will divide the management into many small parts and then will use the method of 'sum of the part' . So let us discuss how to watch management. There are so many parameters which an investor can look before an investment. But there are few key parame...

High ROE vs Low ROE! What is the concept of ROE ? Normal and Extended Du-Pont analysis

Image
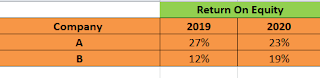
Extended Du-Pont Analysis (The concept of ROE)   Two companies having following ROE which will you buy? Other things are constant.   Definitely an investor will prefer company A as other things are constant. But this will be an irrational behaviour firstly we will go to the root of ROE from where the value has been derived .    Normal DU-Pont Analysis   Extended Du-Pont Analysis   Now Let us understand each parameter one by one. a. Tax Effect : It shows how much the tax a company is paying. If these figures are heavily mismatching then there can be a huge possibility that they are making manipulation in taxes to show profits more. Should not be fluctuated more.   b. Financial Leverage Effect. It shows what the effect of leverage is having upon the profitability of the company.Increasing is better as company is paying less debt In the figure above if we see Company B already has a high leverage effect i.e...

How to trade in volatile market? Options Trading (Straddle and Strangle)

Image
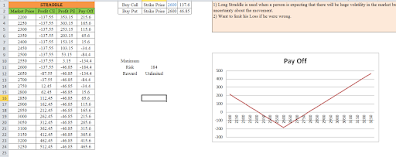
Market Looks Like Volatile ? Manage your risk with proper strategies. Want to trade in the volatile market with proper risk management? When we talk about risk management then suddenly it clicks with options strategies. And out of so many strategies available for options trading we will discuss here two popular strategies for options trading i.e Straddle and strangle let us understand how these strategies work in a practical way.  Assumed, CMP of  Index 2,700 for both the cases. 1) Straddle : To form the straddle strategy we need to buy a call and buy a put with the strike price near to CMP. Here trader expects that there is some big news or an event but not sure which side the market will move hence he prefers this strategy. Eg: Annual Budget, Financial policy reforms, Government election results, Government policy reforms etc.  Formation: Strike Price 2,600 Buy Call @137.6 Buy Put @ 46.85 With the same strike price which is nearby CMP. See how your pay off w...

How to trade in sideways market? Options Trading (Butterfly Spread)

Image
Butterfly spread ! Market Looks Like Sideways ? Want to trade but with proper risk management. Before an application of butterfly spread you must have a market view as non-volatile. Yes my friend it only works in non-volatile markets.   How to apply practically in the market.?? Which Strike price is required to select ? Let's understand, Many times we see different-different opinions in news channels and on social media that the market will be bullish from there or the market will be bearish from there but if you have understood the market behaviour you will be able to draw your own opinion. And if your opinion is sideways than you are the perfect one who can get benefit from this strategy. For Example: Company A CMP: 2700 Formation: Buy - Cash Outflow Sell - Cash Inflow Major condition : Choose strike price only on the basis of uniformity i.e difference between each strike price should be equal in this case i have taken the difference of 300. You can take 100, 200, or 30...

2 most popular investment style ! Value Investing or Growth Investing

Image
One wrong investment can evaporate all your savings, and one right investment can grow you like anything !  Very nice saying " The stock market is filled with individuals who know the price of everything, but the  value of nothing. ~ Philip Arthur Fisher When we talk about wealth creation it becomes necessary for us to understand what are the investment styles people have used in the past to create wealth.   And the answer is- There are broadly two most popular investment styles 'Value Investment' and 'Growth Investment'   1) Value Investment style:   Warren Buffet the master of Investment is majorly focused on value investing strategies. These strategies are for a long term basis and investment is done only those stocks which have just started performing good but price is not moving up or falling down.These stocks will be available at low Price to earning  and their 'intrinsic value' will be higher than 'market price'. Companie...

What is good P/E ratio ? Invest In High P/E Or Low P/E Stocks

Image
Price to earnings ratio (P/E) Overvalued Or Undervalued???  Most common and wrongly interpreted term in the finance industry. Let us understand the concept of P/E   If the P/E is higher than that of comparable firms, it is said to be relatively overvalued, that is, overvalued relative to the other firms ("Not necessarily overvalued on an intrinsic value basis"). The converse is also true: if the P/E is lower than that of comparable firms, the firm is said to be relatively undervalued  ("Not necessarily undervalued on an intrinsic value basis"). Price to earnings is the ratio which shows how much respect the market is giving to a particular company for his future potential. Example: If P/E is 20 it means i am ready to pay 20 rs for every 1 rs earnings. Let’s move on a case study to understand the concept . Industry - Information Technology. Company A - P/E 20,  Sales - 100 Lakhs, Profits- 20 Lakhs Company B - P/E 80 , Sales -100 Lakhs, P...

How to analyse an industry? Industry Analysis! Cement Industry (Porter 5 forces model)

Image
  Porter 5 Forces Analysis Cement Industry (India)   India is the second largest producer of cement after china. Total production of cement is approx 350 mn tonnes since the past couple of years. Cement industry is a kind of ' cyclical industry ' which is dependent on expansion and contraction of the economy. Let's take a look how it depends. For example if the economy is growing only then there will be construction activities like Housing construction, Commercial Constructions or Industrial Constructions. Government initiatives are also helpful for the boost in this sector. If we pay attention, the government has taken initiatives by allowing expenditure outlay of approx  25,000 cr out of which 13,000 cr is allocated for the project of 98 smart cities.  Which is somehow creating opportunity in the sector. This sector is majorly controlled and supervised by the government which interferes with its price. It is a kind of concentrated sector as we can see on...