Posts

Showing posts with the label risk manangement

HDFC AMC- Observation
Image
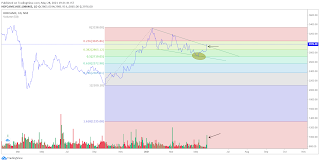
 Swing Trade. Lets Look at the HDFC AMC chart and try to analyze its behavior. We will apply here 2 ways analysis means on one side we will look for price action and on second side we will look for indicators. Price Action: If we see the line chart there is "Flag and Pennant" pattern one of the most powerful pattern in technical analysis. We can see that price exactly respect the 50 Fibonacci ratio which is a very good ratio (where pullbacks are retested) and move. If you see it gave good a breakout of pennant pattern with good volume.  Now let us switch to candlesticks to get more 3D kind of view. What indicator tells? If you see the chart here you will find that there was squeeze and it broke out that means its volatility is increasing. Also if you see that there is RSI above 60 which indicates the momentum or speed. Also there is MACD crossover which also generates a buy signal. So from both of the side stock is looking nice for swing trading. Target Now the question is ho...

M&M finance Observation

Image
Swing Trade   Lets Look at the M&M finance and try to analyze its behavior. We will apply here Top -Down means we are going to analyze from higher time frame to lower time frame. 1 Month Time frame Look at this 1 months chart. Here we can see that there was 3 wave pattern which was ended by making the TOP of  224.30 after that stock went into correction mode and came near to the low 149.60 but did not break it and start turning up.  Weekly Time Frame Now move to one time frame lower and try to analyze weekly time frame what it is doing. Here we can see a beautiful compression pattern that means if you will see back you will find that it took him 2 weekly candle a fast move to make that high of 224.30 with good volume. But when price came back to the same level volume was drying and took more than 10 candle to cover full move. And now it is making support at 40 RSI. and also 50 SMA. Which is a good sign. Daily Time Frame Now move to one day time frame.  Here we ca...

How to classify the industry (Growth, Cyclical, Defensive) manage your risk with proper diversification.

Image
 Want to invest in the Stock Market but am confused about which INDUSTRY  should I invest in??? This is for you ! Industries basically work as per the Economy's (Expansion/Contraction) There are 4 types of industries. 1. Growth Industry :   New Start-up Stage in Industry Life Cycle Solid Earning Figures Risky Stock High Return.   2. Cyclical Industry: Growth is dependent on Expansion and Contraction Of economy. Include those that produce durable goods or heavy equipment. People spend more when they have good income. E.g.. Airline   3. Defensive Industry: Food Processing Industry. Provides necessities for consumers withstand recession and depression. E.g.. FMCG   4. Cyclic Growth Industry: Both characteristics of Cyclical and Growth Industries. Change in technology and intro of new models help them resume growth. E.g.. Automobile .   Everyone wants to beat the benchmark. It can be Nifty 50, Nifty Mid Cap or any other INDEX.   So attached video...

How to trade in volatile market? Options Trading (Straddle and Strangle)

Image
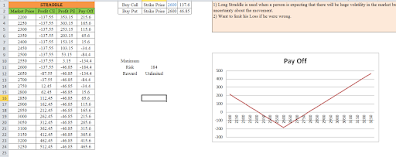
Market Looks Like Volatile ? Manage your risk with proper strategies. Want to trade in the volatile market with proper risk management? When we talk about risk management then suddenly it clicks with options strategies. And out of so many strategies available for options trading we will discuss here two popular strategies for options trading i.e Straddle and strangle let us understand how these strategies work in a practical way.  Assumed, CMP of  Index 2,700 for both the cases. 1) Straddle : To form the straddle strategy we need to buy a call and buy a put with the strike price near to CMP. Here trader expects that there is some big news or an event but not sure which side the market will move hence he prefers this strategy. Eg: Annual Budget, Financial policy reforms, Government election results, Government policy reforms etc.  Formation: Strike Price 2,600 Buy Call @137.6 Buy Put @ 46.85 With the same strike price which is nearby CMP. See how your pay off w...

How to 'hedge' the portfolio with the help of Derivatives? Futures and Options

Image
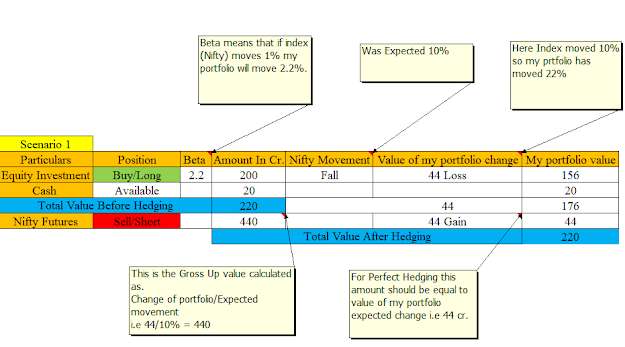
Hedge the portfolio with the help of 'Derivatives' (Futures). I have invested in the Stock Market but I am afraid that my portfolio might fall drastically and it has high probability.... How can I protect myself  from uncertain high probability loss ??? Here Comes into a picture the word 'Hedging'. Now the question arises how can i hedge my portfolio and the answer is 'Derivatives'. Yes my friend it is only possible with the help of derivatives. There are four types of derivatives Forward, Futures, Options and swaps. We will only discuss here about the Futures. Now understand the concept of perfect hedging with the help of FUTURES.  Let's take an Example- You have a diversified equity investment 200 cr and available balance in bank 20 cr. Beta of the portfolio - 2.2 (calculated as per specified approach) Nifty CMP: 11010  NIFTY futures 11500 expected fall maximum 10% from here. Now how many futures need to be sold for perfect hedging? 1 Index futur...

How does professional trader trade in the market? Professional Trading ! Risk Management

Risk management vs Accuracy (luck)   Why risk management overrule above all trading strategies??? Why does risk management overrule all charts, patterns and indicators in the stock market??? What risk management actually is??? How does it apply in live trading???   So many questions are there…and the answer is- Mindset > Strategy ! "Market rewards you only when, you stick to your logic..even if market is against to you"     Let's understand with my practical experience.. I was trading in market on the basis of my trading style ( it can be any style how you trade in the market ). I preferred to take only those trades where my Stop Loss and Target Price ratio would be 1:3 First Scenario (Risk Management) Trade 1: - 1,000 Trade 2: - 500 Trade 3: - 300 Trade 4: - 200 Trade 5: + 2,500 In this scenario I earned +500 pts Here my accuracy was 20% (unlucky) still I earned +500 pts. Second scenario (No Risk Management) Trade 1: +700 Tra...