Posts

Showing posts with the label stock market

Savita Oil - Small Cap Company

Image
 #techno_funda_analysis Fundamental Analysis: Following Table shows the performance of all three major department of the business like.  Marketing Department. Finance Department Operations department. Let's more extend the marketing department performance as it is main department which generates revenue and responsible for any business profitability. If we see fundamentally the company's marketing department has shown a phenomenal growth rate of 44% CAGR. which is a good sign. Also EPS wise company has grown phenomenal rate. Earlier where they were generating 64 Rs. for every share now they can generate159 Rs. per share.  Altman Z-Score -4.70( Good For Solvency) Piotroski F-Score - 7 ( Good for performance as compared to last year) Modified C-Score - 4 (There might be a chance of accounting manipulation)  Technical Analysis: Good time to consider the stock as an entry point as per technical analysis.

TANFAC Industries -SMALL CAP

Image
  #techno_funda_analysis Fundamental Analysis: Following Table shows the performance of all three major department of the business like.  Marketing Department. Finance Department Operations department. Let's more extend the marketing department performance as it is main department which generates revenue and responsible for any business profitability. If we see fundamentally the company's marketing department has shown a phenomenal growth rate of 44% CAGR. which is a good sign. Also EPS wise company has grown phenomenal rate. Earlier where they were generating 3 rs for every share now they can generate17 rs per share.  Altman Z-Score -14.53 ( Good For Solvency) Piotroski F-Score - 6 ( Good for performance as compared to last year) Modified C-Score - 0 (There is no accounting manipulation)  Technical Analysis: Good time to consider the stock as an entry point as per technical analysis.
HDFC AMC- Observation

Image
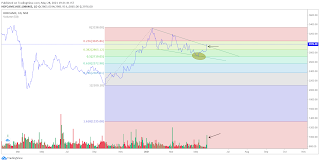
 Swing Trade. Lets Look at the HDFC AMC chart and try to analyze its behavior. We will apply here 2 ways analysis means on one side we will look for price action and on second side we will look for indicators. Price Action: If we see the line chart there is "Flag and Pennant" pattern one of the most powerful pattern in technical analysis. We can see that price exactly respect the 50 Fibonacci ratio which is a very good ratio (where pullbacks are retested) and move. If you see it gave good a breakout of pennant pattern with good volume.  Now let us switch to candlesticks to get more 3D kind of view. What indicator tells? If you see the chart here you will find that there was squeeze and it broke out that means its volatility is increasing. Also if you see that there is RSI above 60 which indicates the momentum or speed. Also there is MACD crossover which also generates a buy signal. So from both of the side stock is looking nice for swing trading. Target Now the question is ho...

M&M finance Observation

Image
Swing Trade   Lets Look at the M&M finance and try to analyze its behavior. We will apply here Top -Down means we are going to analyze from higher time frame to lower time frame. 1 Month Time frame Look at this 1 months chart. Here we can see that there was 3 wave pattern which was ended by making the TOP of  224.30 after that stock went into correction mode and came near to the low 149.60 but did not break it and start turning up.  Weekly Time Frame Now move to one time frame lower and try to analyze weekly time frame what it is doing. Here we can see a beautiful compression pattern that means if you will see back you will find that it took him 2 weekly candle a fast move to make that high of 224.30 with good volume. But when price came back to the same level volume was drying and took more than 10 candle to cover full move. And now it is making support at 40 RSI. and also 50 SMA. Which is a good sign. Daily Time Frame Now move to one day time frame.  Here we ca...

Master Swing Trader (Toolkit)

Image
  Get an edge in your 'Trading' and timing the 'Entry' and 'Exit Points. Free reading PDF.

Bank Nifty- Observation

Image
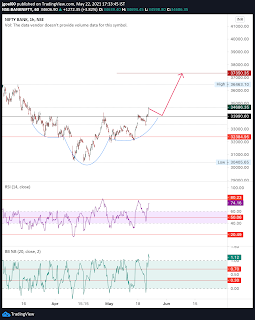
 Bank Nifty ( Head and shoulder Pattern)  A very nice head and shoulder pattern has given a breakout on Friday in BankNifty on 1hourly time frame we can see it very nicely.  Now as per the rule it provides target as equal to the depth of the head and neckline. Which is almost 10% so we can expect a 10% upward move in Bank Nifty.  There might be two consequences: 1. It may directly go towards target where it will be difficult to manage risk( so it is advisable if market open high on Monday avoid the entry) 2. If market pull backs toward neckline of the head and shoulder so that will be nice trade we can enter if it makes support and suits our risk parameter. Thank you.

Emotions Vs. Logic Stock Market Trading.

Image
 Why do most of the traders fail to make money? Can a 12th pass candidate earns millions from the stock market...   Emotions play a very crucial role in trading in the stock market. I have observed that many times a well educated person (i.e. Technical Analyst) fails to make money and a common person who knows nothing about it but basics does wonder.  How does it happen? See, Stock Market is filled with the numerous of brains which comprises of several major emotions which every human being does carry i.e. Fear, Greed, Anger and Hope. And these emotions have no link with the education qualification of any person. A highly graduated masters degree holder or a normal graduated person both can have these emotions. Major winner will always be the person who will manage their emotions, not the one who is more qualified. Briefly understand how the market works, Whether you agree or not but it is true, Market is moved by market makers (20% people have la...

Bitter Truth Of Stock Market

Image
  Truth behind trading in the stock market. There are a lot of advisors in the stock market (i.e. so called 'Technical Analyst') who keep predicting levels of the security weather it is a 'Stock' ( e.g. Reliance, Tata motors, Cipla etc.) or an 'Index' (e.g. Nifty, Bank Nifty etc..) with so much of conviction that you can't stop yourself besides believing to those. My first question is how can you predict the price? There are not only a few people who are making the price but billions of people's minds are working behind the price movement. How can you read those minds?  Anyhow they start predicting with daily price levels, weekly price levels, monthly price levels and so on. Which is leading to people a tendency of speculation.  Just try to understand what happens in the stock market. These people predict the price with so much of conviction that you have no other choice but to believe them. When the price goes up they come up as a 'HERO' . Hey !...

Trading with insiders not with masses

Why do retail investors always suffer with losses? Are "Institutional Investors" the only one who has the right to make money?  These types of so many questions I was asking to myself and when you ask questions there is an answer. I was reading a very nice book where a concept of 80/20 pareto principle was nicely explained. I would like to summarize the whole book concept and betting that it will definitely help you provide an edge in investing. Firstly, I would like to brief you about Pareto principles. What does it say?  This is the principle of "Vital Few" which says 80% consequences come from 20% causes. It applies everywhere. Firstly, it is observed in 'ITALY' where 80% of land was occupied by 20% of the population. Another observation is that 20% is the conclusion of the whole book, 20% of your clothes you wear 80% of the time. Remember it is not a thumb rule but is just an observation and this simple observation works  wonders in the 'Stock Market...