Dabur India (Chart Analysis)
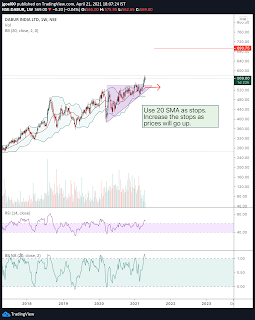
1. Here we can see a nice pattern of straight top and rising bottom. Generally if these kind of patterns are form than it is good chance that stock could achieve the target of width of the triangle.
2. Stock is in good momentum as we can see RSI is above 60 of monthly, weekly and Daily.
3. Moreover there is squeeze break out this means it has increased its volatility.
4. Stock falls under the sector FMCG


Comments
Post a Comment
Please do not comment any spam links.