Posts

Savita Oil - Small Cap Company

Image
 #techno_funda_analysis Fundamental Analysis: Following Table shows the performance of all three major department of the business like.  Marketing Department. Finance Department Operations department. Let's more extend the marketing department performance as it is main department which generates revenue and responsible for any business profitability. If we see fundamentally the company's marketing department has shown a phenomenal growth rate of 44% CAGR. which is a good sign. Also EPS wise company has grown phenomenal rate. Earlier where they were generating 64 Rs. for every share now they can generate159 Rs. per share.  Altman Z-Score -4.70( Good For Solvency) Piotroski F-Score - 7 ( Good for performance as compared to last year) Modified C-Score - 4 (There might be a chance of accounting manipulation)  Technical Analysis: Good time to consider the stock as an entry point as per technical analysis.

TANFAC Industries -SMALL CAP

Image
  #techno_funda_analysis Fundamental Analysis: Following Table shows the performance of all three major department of the business like.  Marketing Department. Finance Department Operations department. Let's more extend the marketing department performance as it is main department which generates revenue and responsible for any business profitability. If we see fundamentally the company's marketing department has shown a phenomenal growth rate of 44% CAGR. which is a good sign. Also EPS wise company has grown phenomenal rate. Earlier where they were generating 3 rs for every share now they can generate17 rs per share.  Altman Z-Score -14.53 ( Good For Solvency) Piotroski F-Score - 6 ( Good for performance as compared to last year) Modified C-Score - 0 (There is no accounting manipulation)  Technical Analysis: Good time to consider the stock as an entry point as per technical analysis.

Can you invest Motilal Oswal right Now?

Image
Motilal Oswal What fundamental says.? If you see from past 5 years income is increasing. It has almost 3 times within 6 years. EPS has also increased in FY-19 and FY- 20 it has decreased but this was the scenario of COVID where banks faced NPAs. It generally trade at the average PE of around 25 times. Currently it is trading at the PE of 10 times. Institutions are also increase their buying.     What technical says.? Monthly chart  Weekly chart Volume Profile I

Profitable Candlestick Trading

Image
 PROFITABLE CANDLESTIC TRADING One of the best book to understand candlesticks trading. Free PDF reading. 

HDFC AMC- Observation

Image
 Swing Trade. Lets Look at the HDFC AMC chart and try to analyze its behavior. We will apply here 2 ways analysis means on one side we will look for price action and on second side we will look for indicators. Price Action: If we see the line chart there is "Flag and Pennant" pattern one of the most powerful pattern in technical analysis. We can see that price exactly respect the 50 Fibonacci ratio which is a very good ratio (where pullbacks are retested) and move. If you see it gave good a breakout of pennant pattern with good volume.  Now let us switch to candlesticks to get more 3D kind of view. What indicator tells? If you see the chart here you will find that there was squeeze and it broke out that means its volatility is increasing. Also if you see that there is RSI above 60 which indicates the momentum or speed. Also there is MACD crossover which also generates a buy signal. So from both of the side stock is looking nice for swing trading. Target Now the question is ho...

IOC Chart Observation

Image
 CUP Pattern (4 Months) Conditions: 1. Pattern must be at least 6 to 8 weeks. 2. There should be great volume on right side of the pattern. 3. May re-test or not the neckline. In this case it has tested. 4. Target should be around the depth of the CUP. 5. Stop loss should be bellow the Re-tested Zone. Additional Check. 1. RSI above 60. There is momentum in the price. 2. BB% greater than 70 there is volatility in the chart. Target - 121 Stop Loss - 103 Risk to Reward 1.5 Note: This is for knowledge purpose only.

Buyable Gap Up

Image
How to Trade or Invest using GAPS? Most scary thing in the world of 'stock market' is 'gaps-up'. it becomes very difficult to manage trade when security opens 'Gap-up'. So what is the right way to trade gaps or take position on the basis of gaps. There are three rules that must be check before trading gap-up market. 1. ATR :  Check 40 period ATR before gap-up. The price move must be at least 75% of that value. 2. Volume : Volume must be 150% of 50 DMA volume. This Gap-up must be occur in constructive consolidation or an uptrend. Let's look at the chart and understand. Let's look at the chart.  There is a Gap-up 40 period ATR before Gap-up was 111.89. Price should Gap-up at least 75% of ATR that means 83.91. We can see price Gapped-up 245 (i.e. 32,450 - 32,205) Volume is 150% or 3 times. 50 SMA Volume is 162.40K and Gapped-up volume is 527.42K All three conditions are meeting the criteria. Now where to entry and what should be your stop loss is clearly me...

M&M finance Observation

Image
Swing Trade   Lets Look at the M&M finance and try to analyze its behavior. We will apply here Top -Down means we are going to analyze from higher time frame to lower time frame. 1 Month Time frame Look at this 1 months chart. Here we can see that there was 3 wave pattern which was ended by making the TOP of  224.30 after that stock went into correction mode and came near to the low 149.60 but did not break it and start turning up.  Weekly Time Frame Now move to one time frame lower and try to analyze weekly time frame what it is doing. Here we can see a beautiful compression pattern that means if you will see back you will find that it took him 2 weekly candle a fast move to make that high of 224.30 with good volume. But when price came back to the same level volume was drying and took more than 10 candle to cover full move. And now it is making support at 40 RSI. and also 50 SMA. Which is a good sign. Daily Time Frame Now move to one day time frame.  Here we ca...

Master Swing Trader (Toolkit)

Image
  Get an edge in your 'Trading' and timing the 'Entry' and 'Exit Points. Free reading PDF.

Bank Nifty- Observation

Image
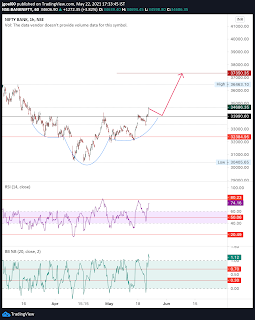
 Bank Nifty ( Head and shoulder Pattern)  A very nice head and shoulder pattern has given a breakout on Friday in BankNifty on 1hourly time frame we can see it very nicely.  Now as per the rule it provides target as equal to the depth of the head and neckline. Which is almost 10% so we can expect a 10% upward move in Bank Nifty.  There might be two consequences: 1. It may directly go towards target where it will be difficult to manage risk( so it is advisable if market open high on Monday avoid the entry) 2. If market pull backs toward neckline of the head and shoulder so that will be nice trade we can enter if it makes support and suits our risk parameter. Thank you.

PNC Infratech ltd.

Image
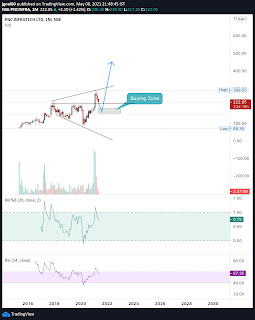
1. Very nice broadening pattern. 2. A nice breakout from weekly levels and a nice pullback as well. 3. RSI above 60 on monthly. 4. Good fundamental stock. 5. Good management. 6. FIIs increasing the stake.

Chart Pattern (Technical Analysis)

Image
 Silver observation - Pole And Pennant Pattern Silver might be a good investment . Wait for the right opportunity .  1. Pole and pennant pattern .  2. RSI comes to 50 at first time from 80 RSI and goes sideways between 60 and 50 RSI .  CONFIRMATION 1. When RSI will close above 60 and % B will Also close above 1. DOUBLE CONFIRMATION . When Pennant pattern will break . Target would be length of the pole make sure to put STOPS as well

Dabur India (Chart Analysis)

Image
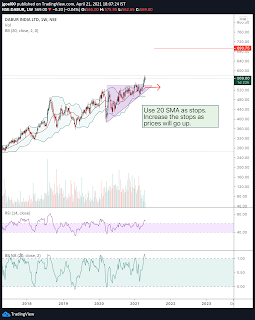
1. Here we can see a nice pattern of straight top and rising bottom. Generally if these kind of patterns are form than it is good chance that stock could achieve the  target of width of the triangle.  2. Stock is in good momentum as we can see RSI is above 60 of monthly, weekly and Daily. 3. Moreover there is squeeze break out this means it has increased its volatility. 4. Stock falls under the sector FMCG

COVID Proof Investment !

Image
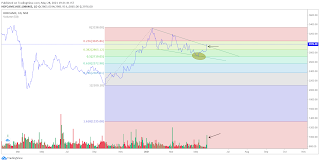
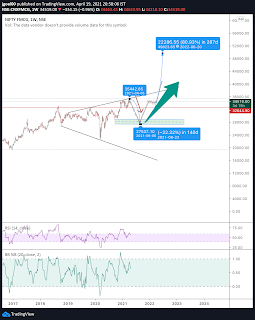
NIFTY FMCG OBSERVATIONS   Here we do NIFTY_FMCG analysis it is the safest sector for investment right now . Reasons : 1. It is a defensive sector and consumer need based sector . 2. Debt is low as compare to other industries so there is no harm of fixed interest cost . 3. Last time during pandemic it was the first sector which recovered in v - shape . 4. Broadening pattern it has completed its 5 touches if it takes support near support zone highlighted in the chart . It will bounce like a It has been consolidated for long time also . Thanks

Chart Patterns (Technical Analysis)

Image
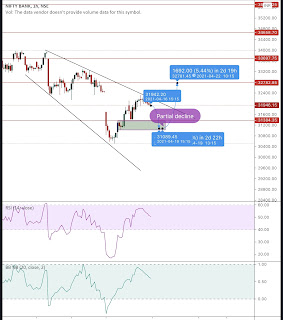
  BROADENING WEDGES Let’s understand broadening wedge pattern. It is a pattern where trend channel narrow at beginning and keeps broadening. We can have upward or downward breakout. But here we can see that it has already touched its 3 points on upper trend line and there is strong support near 32,100 so we are required a partial decline. Which will be around 32100 and if it takes support near that zone than we can have an upward breakout and we can achieve 32,800 level. Let’s watch. Thank you !

Chart Patterns (Technical Analysis)

Image
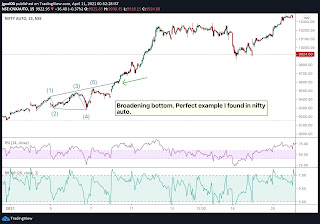
BROADENING BOTTOMS Broadening bottom live example. Two higher highs and two lower low is required for broadening bottom. 3rd high will retrace little and break that resistance line. Take the trade  #stockmarketindia    #technicalanalysis   #trading   #nseindia #autoindustry   For educational purpose

Chart patterns (Technical Analysis)

Image
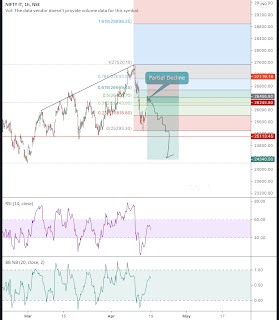
BROADENING FORMATIONS, RIGHT - ANGLED AND  ASCENDING Hi Investors there is " Broadening Formations , Right - Angled and Ascending " found in NIFTY IT . As per this formation there will be horizontal support and a ascending resistance line. Mostly breakout will be provided on downside . One partial decline is required which is almost done done it has touched its Fibonacci 50 % level you can avoid IT stock as it is short term bearish reversal sign . There will be good buy again in IT near 2430. thank yoU

Accumulation VS Distribution Phase

Image
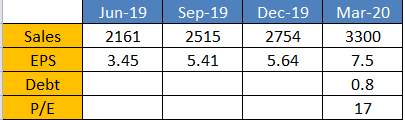
  How to know if the stock of a company is in 'Accumulation Phase' or Distribution Phase'?   This is a very common question every investor asks before an investment in value stocks. Sometimes what we see is stock, take the move and go sideways so it becomes difficult for an investor  to identify whether this sideways phase is for accumulation or distribution and how we should understand this ? Here is the simple trick with the help of which you can easily identify the stock phase. There are three major players (Smart Money) which play an important role in shareholding of any company. a) Promoter. b) Mutual fund or Insurance companies. c) FIIs (Foreign Institutional Investors) So let us understand how we will identify smartly which company is good for investment. Step 1: Find a good fundamental company.( Smartly) a. Sales must be increasing. b. EPS should be increasing. c. Low debt. d. P/E should be less than industry. eg. KEC intnl. Step 2: L...

Trading in Zones (Multiple Time Frame Analysis)

Image
How To Trade Demand/Supply Zone??   "MULTIPLE TIME FRAME ANALYSIS" Step One. Find the  Supply/Demand Zone : This is the zone from where the price has been departured too far.   Time frame 5 min Step Two Go to 5 or 6 times Lower Time Frame 1 min in this scenario as the above chart is for 5 mins.   Step Three:  Find the *reversal candlestick* pattern only on a lower time frame and Supply/Demand Zone whatever the case may be. *Hammer *Doji *Piercing. *Engulfing *Tweezer Top/Bottom. Note: Remember these patterns are only useful and effective in Zones. Take the trade with proper SL  R: R must be at least 1:2 Trading is a combinations of Zones, Candlesticks patterns and indicators. Rules to remember: 1. When trade zones never trade only one time frame. Otherwise you will not get better risk and reward. Moreover you may missed the trade because lower time frame change earlier than higher time frame. 2. Trade only those reversal candlestick patterns which are ...

Emotions Vs. Logic Stock Market Trading.

Image
 Why do most of the traders fail to make money? Can a 12th pass candidate earns millions from the stock market...   Emotions play a very crucial role in trading in the stock market. I have observed that many times a well educated person (i.e. Technical Analyst) fails to make money and a common person who knows nothing about it but basics does wonder.  How does it happen? See, Stock Market is filled with the numerous of brains which comprises of several major emotions which every human being does carry i.e. Fear, Greed, Anger and Hope. And these emotions have no link with the education qualification of any person. A highly graduated masters degree holder or a normal graduated person both can have these emotions. Major winner will always be the person who will manage their emotions, not the one who is more qualified. Briefly understand how the market works, Whether you agree or not but it is true, Market is moved by market makers (20% people have la...