A bad investment can evaporate all your savings. So, before an investment it becomes necessary that you must have known what to buy ? Which is possible with the help of 'Fundamental Analysis' and when to buy? which will be possible with the help of 'Technical Analysis'.
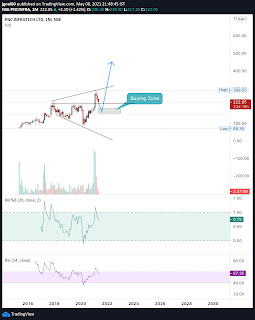
1. Very nice broadening pattern. 2. A nice breakout from weekly levels and a nice pullback as well. 3. RSI above 60 on monthly. 4. Good fundamental stock. 5. Good management. 6. FIIs increasing the stake.
Silver observation - Pole And Pennant Pattern Silver might be a good investment . Wait for the right opportunity . 1. Pole and pennant pattern . 2. RSI comes to 50 at first time from 80 RSI and goes sideways between 60 and 50 RSI . CONFIRMATION 1. When RSI will close above 60 and % B will Also close above 1. DOUBLE CONFIRMATION . When Pennant pattern will break . Target would be length of the pole make sure to put STOPS as well
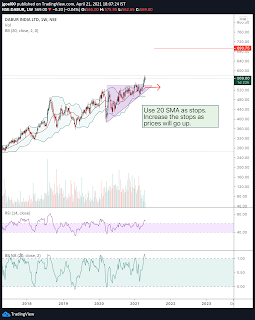
1. Here we can see a nice pattern of straight top and rising bottom. Generally if these kind of patterns are form than it is good chance that stock could achieve the target of width of the triangle. 2. Stock is in good momentum as we can see RSI is above 60 of monthly, weekly and Daily. 3. Moreover there is squeeze break out this means it has increased its volatility. 4. Stock falls under the sector FMCG
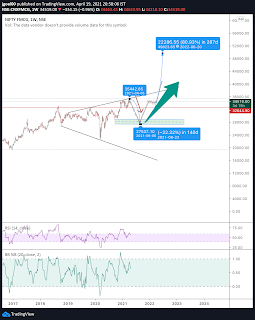
NIFTY FMCG OBSERVATIONS Here we do NIFTY_FMCG analysis it is the safest sector for investment right now . Reasons : 1. It is a defensive sector and consumer need based sector . 2. Debt is low as compare to other industries so there is no harm of fixed interest cost . 3. Last time during pandemic it was the first sector which recovered in v - shape . 4. Broadening pattern it has completed its 5 touches if it takes support near support zone highlighted in the chart . It will bounce like a It has been consolidated for long time also . Thanks